


My favorite thing is to look up the numbers that the candidates give you and see if they are telling the truth or blowing smoke. You can bet any time they quote a number, they are expecting you the voter to sit there and just take it. Trust them. They wouldn't lie.
So, after last nights debate, I decided to look up some information and see what was up.
For example, it eas very easy for me to look up the very misleading education numbers that Sen. Edwards gave during his debate with Dick Cheney, where he says 50% of African American's and Hispanics drop out of school before they finish high school. Upon review of the numbers, it was easy to find out that the drop out rate was 7% for whites, 13% for African Americans and 29% for Hispanics. Of which, the Hispanic population included almost 44% of that number as being immigrants that did not re-enroll in school or had not attended school in their native country. These numbers have been steadily decreasing since 1992.
Want to learn more about the numbers that people quote and the reality behind them? Go to the inner sanctum.
Where do we start? How about the economy?
Recession, In What Hour Did You Begin?
I was looking through some different numbers regarding decreases in salary or family incomes when I came across some the recession indicators.
So, we answer the first question. Were we in a recession or a depression? If you remember correctly, the Kerry/Edwards campaign originally started touting the "misery index" and trying to claim we were in a depression like 1929. The misery index turned out not support the "misery" that Mr. Kerry wanted to show. President Bush's highest rating was 8.6 directly after 9/11 and then decreased to 7.4 and continues a downward trend. In comparison, the highest misery index was created during the Carter Administration which was at 20.6. The President's current misery index is the same as Clinton's at the end of his time in office.
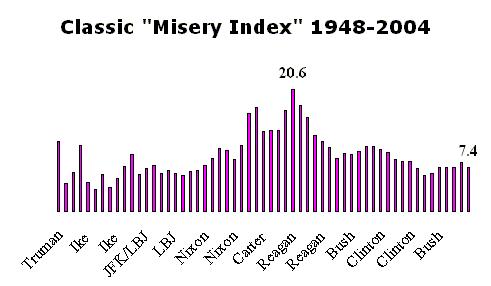
misery index 1948-2004 
According to the National Bureau of Economic Research, the recession became official, March 2001, a few weeks after President Bush was sworn into office January 20, 2001:
The NBER's Business Cycle Dating Committee has determined that a peak in business activity occurred in the U.S. economy in March 2001.
What are the indicators for a recession?
A recession is a significant decline in activity spread across the economy, lasting more than a few months, visible in industrial production, employment, real income, and wholesale-retail trade. A recession begins just after the economy reaches a peak of activity and ends as the economy reaches its trough.
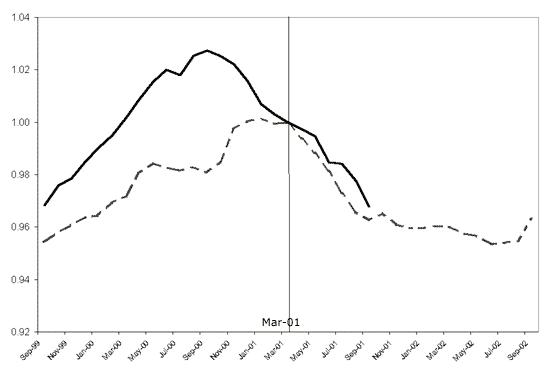
According to the next figures, employment reached it's peak in March 2001 and began sliding off at a slower rate (solid line) than previous recessions' average (dotted line) until Sept 11, where the number began a rapid decrease to match all previous recessions:

current employment compared to previous recessions through 2001
According to labor reports, almost 1.4 million jobs were lost within months after Sept 11.
In short, almost 1.4 million people became unemployed within months of the September 11 tragedy. Prior to that, March 2001 to August 2001, the recession had caused an approximate loss of jobs of 403,000. Two months within that period had shown no increase of unemployment. The bleeding had stopped by February 2002 and by May 2002 modest gains were seen with a total decrease of unemployed people from 8.9 to 8.1 million by September 2002. But then, another economic bust caused unemployment to rise once again from January 2003 to July 2003 with a record 9.1 million unemployed at 6.3%.
NBER goes on to answer an important question about the recession in their FAQs:
Q: The NBER has dated the beginning of the recession in March 2001. Does this mean that the attacks of September 11 did not have a role in causing the recession?
A. No. Before the attacks, it is possible that the decline in the economy would have been too mild to qualify as a recession. The attacks clearly deepened the contraction and may have been an important factor in turning the episode into a recession.
Where are we at today with unemployment?
Kerry claims that over 2.5 million jobs were lost during President Bush's administration and he is right. President Bush claims that over 1.96 million jobs were created and he is right.
According to all indicators, the aggregate job loss is -585,000. Based on current average increase of jobs in the last 12 months, this job loss will be erased by February 2005.
President Bush claims that the recession began before he started office. Is this correct?
Technically, the recession was called in March 2001. A recession is identified after 2 quarters of steady decline after a peak in multiple indicators, including the unemployment that we discussed earlier. However, he is correct to state that the economic peak and decline had began BEFORE his administration took office. Several key indicators support this:
Industrial production through 2001
Industrial production peaked in October of 2000 and began a rapid decline the last three months of 2000 and continuing through 2001.
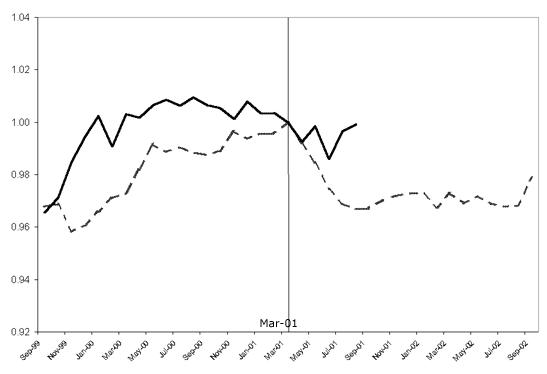
manufacturing and trade through 2001
Manufacturing and trade peaked in November 2000, continued downward until January 2001 where it began a leapfrog pattern.
According to these indicators, President Bush was correct when he indicated that the economic peak had been reached before he took office.
What indicators show either an improvement or decline in the economy?
The first would be the current steady increase in employment. As noted, if the current trends stay in place, the lost jobs will be made up by February 2005. Other indicators would be:
Strangely, consumer confidence has declined for the second month in a row:
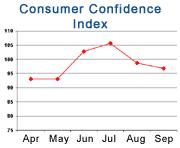
consumer confidence Index 2004
Probably not so strange due to other indicators that we will discuss in our next posting of "Undecided Voters-Politics of Numbers".
The ignorance of one voter in a democracy impairs the security of all.
John Kennedy, May 18, 1963
Trump’s China Trap
1 day ago


No comments:
Post a Comment